Instruments: what each one measures, and what it misses
How does a refractometer read a coffee?
Start the scene or choose a stage. The animation simplifies the mechanism; what follows gives the details and the available references.
The sample is left to cool for fifteen minutes, filtered, the prism is cleaned and the instrument is reset to zero before each reading. These instructions are not superstitions: temperature, oils and suspended fines throw off the measurement.
Read the stages without animation
- Prepare the sampleThe sample is left to cool for fifteen minutes, filtered, the prism is cleaned and the instrument is reset to zero before each reading. These instructions are not superstitions: temperature, oils and suspended fines throw off the measurement.
- The light bendsLight is bent when it passes through a liquid, and the angle of this deflection, refraction, depends on what is in it. The more loaded the coffee, the more the boundary between light and dark shifts on the sensor.
- A curve gives the TDSA calibration curve converts the angle into a percentage of dissolved solids. The VST instruments, at the end of the 2000s, then the Atago PAL-Coffee and DiFluid, at a tenth of the price, read to a hundredth of a percent.
- What skews the readingCalibration assumes a typical composition for coffee, and not all coffees conform to it. Prepared the same way, a Kenya or a Burundi reads up to 1.70% dissolved solids, a Panama 1.36%: more solubles, or a composition that skews the reading? We cannot decide.
To remember: The refractometer measures an angle; the TDS it displays depends on a calibration made for a typical coffee.
In history: The first benchtop instruments tuned for coffee are those of Vince Fedele, in the United States.
Read the full article and its sources ↓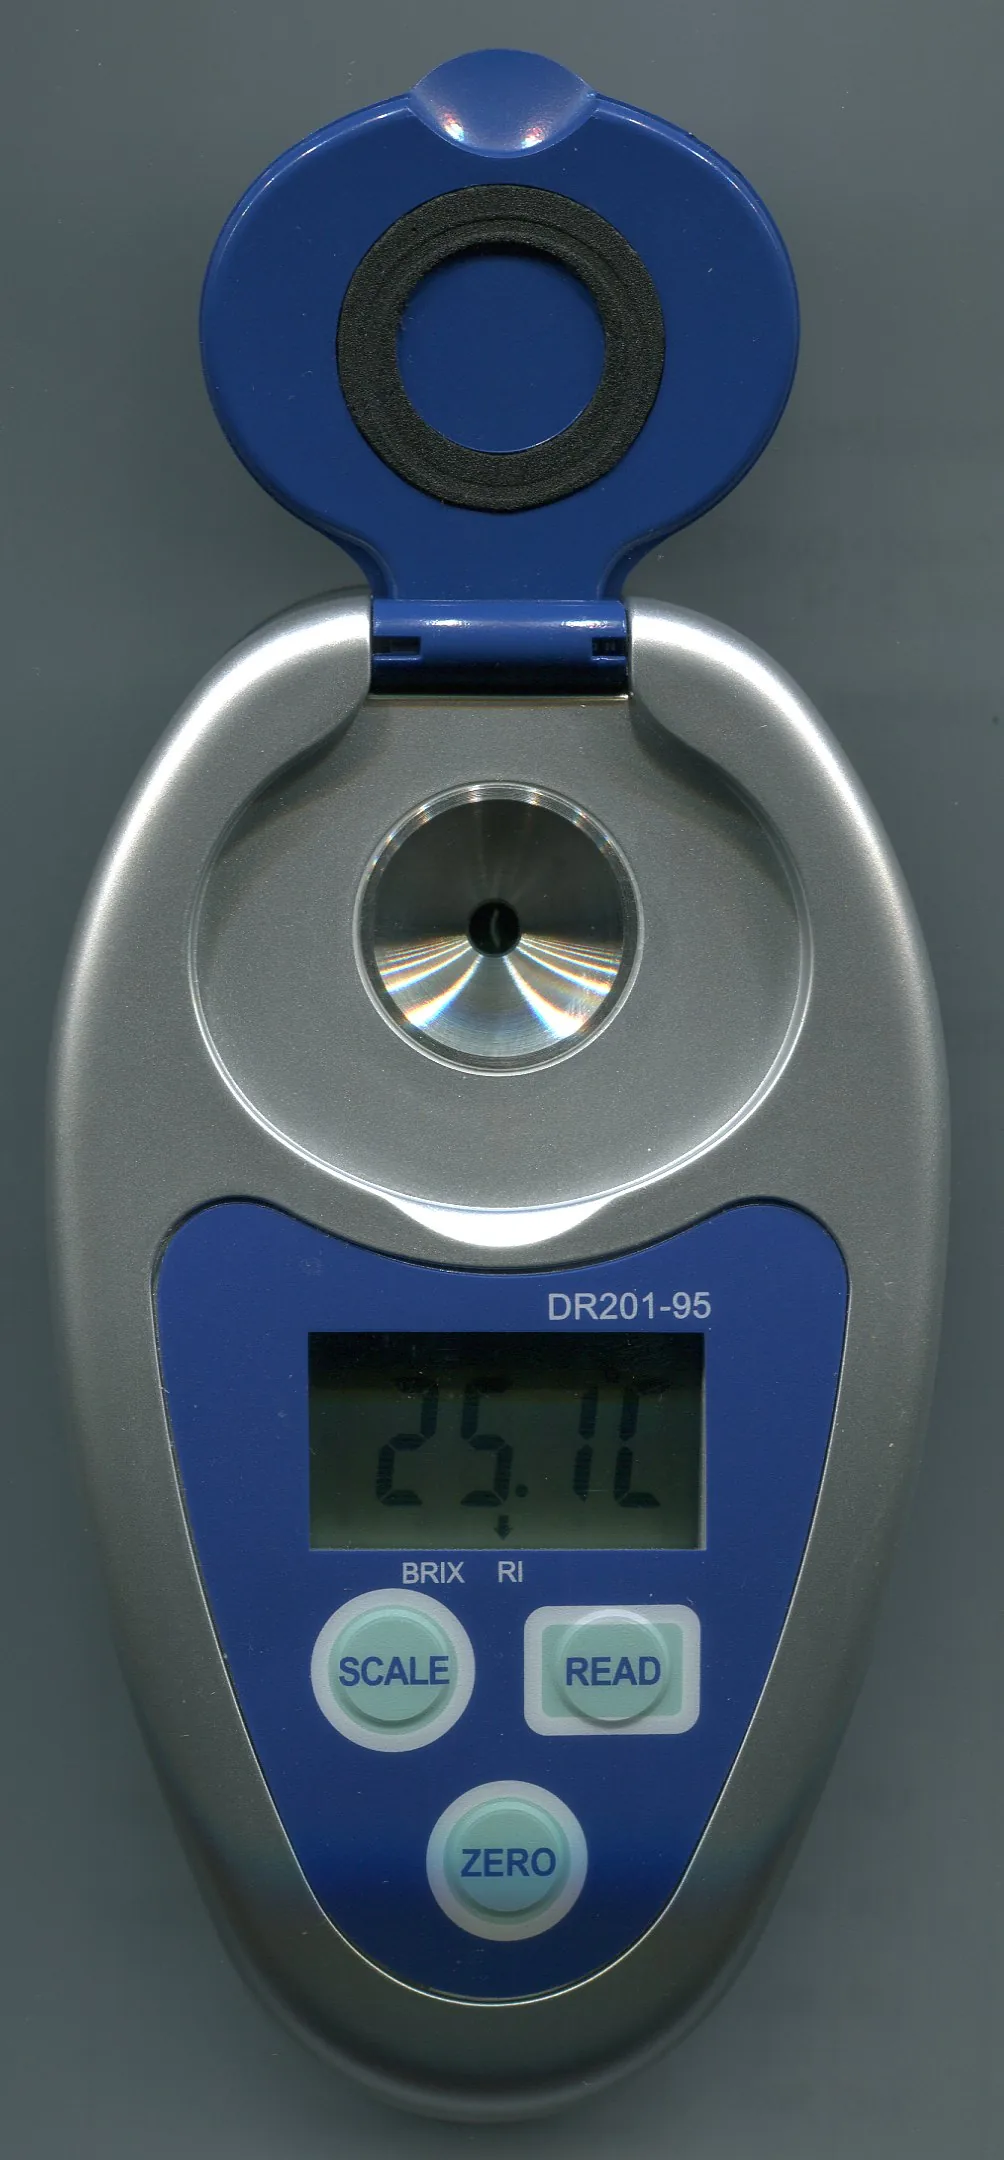
The refractometer starts from a simple optical principle: light is bent when it passes through a liquid, and the angle of this deflection depends on what is in it. A calibration curve converts this angle into a percentage of dissolved solids.
The first benchtop instruments tuned for coffee were those of VST, by Vince Fedele in the United States, at the end of the 2000s. Atago followed with the PAL-Coffee in Japan, then DiFluid in China in the 2020s, at a tenth of the price. They read to a hundredth of a percent.
Their limit lies in the word calibration. It assumes a typical chemical composition for coffee, and not all coffees conform to it.
Gagné documents it: the yields he calculates vary systematically by origin. Kenyas, Burundis and Africa in general extract more, up to 1.70% dissolved solids against 1.36% for a Panama prepared the same way. And one cannot decide between two explanations: do these beans really contain more solubles, or does their composition skew the reading?
Other things throw off the measurement, more mundane ones: the temperature of the sample, the oils, the suspended fines. Hence the usual instructions, which are not superstitions: let it cool for fifteen minutes, filter, clean the prism, and reset to zero before each reading.
The conductivity meter, for its part, is used only for water, and one must know what it is worth. It deduces dissolved solids from electrical conductivity, through a ratio arbitrarily set at 0.5 or 0.7 depending on the brand. It depends strongly on temperature, with up to 20% error if it is not corrected, and it is accurate to within 30%.
Above all, it says nothing about alkalinity, which matters more than hardness for the cup. For a few euros, the aquarium titration kits, those that measure KH and GH, do better than it does.
Gagné 2021, p. 35 (Wellinger, Smrke, Yeretzian 2017), p. 173-174 and p. 199-200; professional training document, tasting guide, p. 5How can one objectively measure how roasted a coffee is? By looking at its color, but with an instrument rather than the eye.
The colorimeter sends near-infrared light onto the bean or the grounds, measures what comes back, and converts this reflectance into a number.
The reference is Agtron, of Reno, Nevada. Its M-Basic model has served as the SCAA's reference since 1995. That year, Carl Staub and the association published a set of eight color disks, running from 95, very light, to 25, very dark. These disks gave the trade a physical standard to compare against, and that is what made Agtron the reference. It reads on the Gourmet scale, from 0 to 100.
Other manufacturers each have their own instrument, and above all their own scale.
- Neuhaus Neotecthe Colortest II, in Germany.
- Probatthe Colorette.
- Lighttellsthe CM-100 and CM-200, in Taiwan.
Roastrite and Javalytics complete the list.
And here is the trap, which costs dearly to anyone who ignores it: these scales cannot be converted exactly into one another. A protocol that announces “Agtron 58 whole bean, 63 ground,” or “Colortest 85-95 whole bean, 100-120 ground,” is reproducible only with the instrument it names. The number without the brand means nothing.
The advantage of the instrument is that it takes color out of the judgment of the eye, which drifts with lighting and with fatigue. Its drawback is that it measures only the surface, or the average of a grind. Two coffees of the same outer color can differ in their inner development, and that is why both are measured, whole bean and ground, and why the gap between the two is read rather than each number separately.
Green coffee, for its part, has its own instruments, and each one watches for a specific risk. The capacitive moisture meter, from Sinar or Kett, must stay below 12.5%. Water activity, measured at Rotronic or Aqualab, must stay below 0.7 to contain ochratoxin, a mold toxin. And bulk density approximates the altitude and hardness of the bean, which guides the charge temperature.
SCAA/Agtron, Roast Classification Color Disk System (1995); SCAA, Cupping Protocols (2004); professional training document, tasting guide, p. 4; Yang et al. 2026, p. 15-16| Instrument | Measurement | Principle | Brands cited | Limite |
|---|---|---|---|---|
| Refractometer | Brew TDS (%) | refractive index + calibration | VST, Atago, DiFluid | composition, temperature, fines |
| Conductivity meter | Water TDS (ppm) | conductivity × 0.5-0.7 | EC pens | ± 30%; silent on alkalinity |
| Colorimeter | roast degree | near-infrared reflectance | Agtron, Neuhaus, Probat, Lighttells | non-convertible scales; surface only |
| Moisture meter, aw meter | water in the green coffee | capacitance; vapor equilibrium | Sinar, Kett, Rotronic | thresholds 12.5% and 0.7 |
| GC-MS, GC-O | volatiles, key odorants | separation, mass, nose | laboratories | cost; non-volatiles absent |
| Electronic nose | volatile fingerprint | metal-oxide sensors | prototypes since 1992 | drift, humidity, recalibration |
| Aroma kits | memory of the nose | reference vials | Le Nez du Café (36), Scentone (100), Olfactorium (48) | pedagogical, not a measurement |
The laboratory has two tools that the tasting room does not.
The first is gas chromatography coupled with mass spectrometry, GC-MS. It separates the volatiles of coffee, then identifies them one by one. It says what is in the coffee, not what matters. To find out, a human nose is plugged into the outlet of the column: this is GC-olfactometry.
Two methods organize this sniffing. Aroma extract dilution, developed by Ullrich and Grosch in 1987, and Acree's CharmAnalysis in 1984, dilute the extract until the odor is no longer perceived. The compound that holds out longest is the one that weighs the most. This is how we went from a thousand compounds to about thirty key odorants.
Its limits come down to three points. Cost, first. Then sample preparation, which alters fragile volatiles, thiols first. Finally its silence on non-volatiles: these require liquid chromatography, LC-MS, and have remained the poor relations.
The second tool is the electronic nose, an array of metal-oxide or polymer sensors whose response is processed statistically. Gardner, Shurmer and Tan applied it to coffee as early as 1992. It distinguishes origins or roast degrees, but on one condition: staying within a calibrated set of samples.
Outside this frame, it drops out. It drifts over time, reacts to humidity, and must be recalibrated for every lot. Thirty years later, it has found no place in the trade, and the 2026 review does not mention it among the tools of the chain.
Between the two are the tools that train the human nose. Jean Lenoir's Le Nez du Café sorts 36 aromas into four families: enzymatic, sugar browning, dry distillation, defects. These are the ones used in the Q Grader olfactory test. The Korean Scentone T100 set offers 100, and the French set of 48 vials described above follows yet another logic.
And since the 2010s, tasting sheets have become applications: Tastify, Cropster Cup, the SCA's CVA app. They calculate, archive and compare scores between cuppers. For the first time on a large scale, the gap between juries becomes visible.
Ullrich, Grosch, Z. Lebensm. Unters. Forsch. 184 (1987), p. 277-282; Acree, Barnard, Cunningham, Food Chemistry 14 (1984), p. 273-286; Gardner, Shurmer, Tan, Sensors and Actuators B 6 (1992), p. 71-75; Coffee Quality Institute, Q Grader Exams and Calibrations; Yang et al. 2026, p. 14In this plateThe 18 sections
- 01What green coffee contains
- 02What heat makes of it
- 03Five tastes, and touch
- 04The nose, twice
- 05Naming: from trade vocabulary to the wheel
- 06Acidity, six acids and a confusion
- 07How much citric acid is in a coffee? Six answers
- 08Cupping, where the gesture comes from
- 09The protocol
- 10The 2004 scoresheet and what 80 points are worth
- 11Five forms, five philosophies
- 12When chemistry discriminates, and what it really discriminates
- 13The Q Grader
- 14Cup defects and their cause
- 15What each link changes
- 16Extraction: Lockhart, 18 to 22%, and what was made of it
- 17Instruments: what each one measures, and what it misses
- 18Today
The table of contents, with the first sentence of each section